Instrumenting Events Directly Into Supabase so Any Agent or API Consumer Can Query Them Without a Vendor in the Middle
Direct event storage in Postgres lets agents query analytics without proprietary intermediaries.
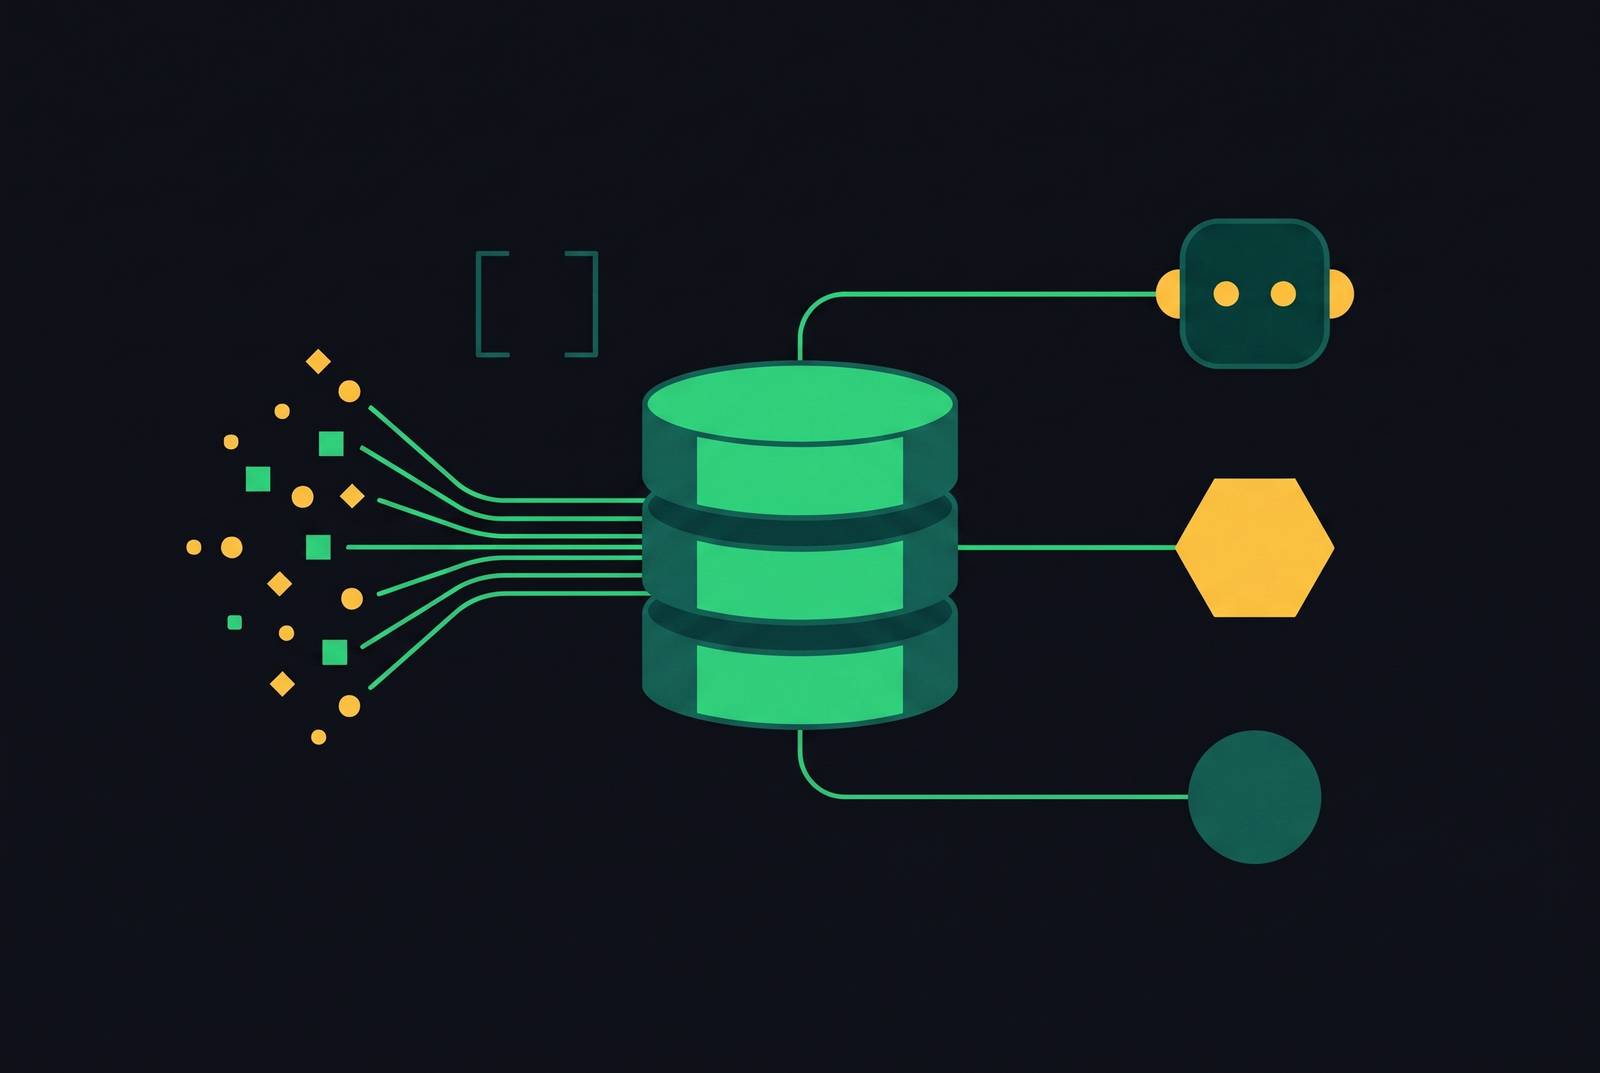
Instrumenting events directly into Supabase Postgres gives API-first and agent-first teams a headless analytics backend without a proprietary vendor layer or an opinionated frontend. Standard SQL and MCP expose the data to programmatic consumers, while a governed read path protects production traffic. The architecture works when events, metric definitions, and access controls form one shared foundation rather than separate systems for dashboards and agents.
Why the traditional analytics vendor is the wrong shape for an agent-first stack
An agent acting on stale or siloed data can take longer to decide and make mistakes that cost money. A customer support agent reading a cached order table may contradict an order state already visible to the customer. Agents operate in an observe-think-act loop, and batch warehouse schedules, typically hourly or longer, leave them observing an earlier version of the business. Better reasoning does not make that version current.
A JavaScript snippet feeds a SaaS event pipeline, which exposes data through a proprietary query surface designed for human dashboard use. Agents need records and tools. Schema translation, API rate limits, and export restrictions get in the way when a programmatic consumer needs direct access it can count on. A dashboard can remain useful despite these constraints, while an autonomous workflow may be unable to act reliably.
MCP has also reduced the integration cost of connecting agents to data sources, weakening the case for a vendor-mediated silo. The protocol gives agents a structured way to discover data and understand its schema and meaning. Access remains the bottleneck when that discovery stops at a proprietary boundary. Starburst's October 2026 analysis identifies secure access to live business data and interpretation across disparate schemas as obstacles to production agent deployments that teams must address before choosing a model.
What analytics backend gives Supabase teams raw API access without a prebuilt dashboard?
A single events table in Supabase can serve as the application's write endpoint, the logical source for dashboards, and the data source for agents. No second event silo is required. Postgres already holds application data that gives events their business context, while Supabase makes that data queryable without a separate analytics service. For teams already building there, this is a practical foundation for usage analytics delivered through APIs.
The initial schema needs columns for event name, user ID, JSONB metadata, and a timestamped created_at defaulting to now(). JSONB accommodates varied event shapes without requiring a schema change for every new event type. The core fields remain explicit and queryable. Indexes on event_name, created_at, and user_id support the grouping and date-range queries that become costly as the table grows. Without appropriate indexes, those queries can require full-table scans.
Application code can submit events through a fire-and-forget insert pattern using .then() rather than await, keeping analytics writes outside the awaited user-facing request path. This separates instrumentation from the response the user needs. Product usage, billing events, and user actions then reconcile to a common source. Sales, finance, and product can discuss what the numbers mean for the business.
Udio scaled to millions of users with Supabase as its system of record for user and application data. Pebblely reached over a million users in seven months while relying heavily on Supabase Auth. These examples establish production adoption, with benchmarking for analytical queries remaining a separate question. The distinction is important because an event store's usefulness still depends on how consumers reach it.
Why analytical queries on the production Postgres instance need a boundary
Postgres is row-oriented and tuned for transactional work, including fast lookups, inserts, and updates. Analytical queries scan and aggregate larger sets of rows, competing with live traffic for CPU and memory when they run on the same instance. The contention is real but avoidable through routing. Supabase's documentation recommends a read replica for complex analytical queries and reserves the primary for user-facing operations. Direct instrumentation therefore does not imply unrestricted analytical access to the primary.
Concurrent queries can exhaust the connection pool, while an access path that skips the governed layer can bypass row-level security. Read-only access on its own leaves these risks in place. The boundary must control where queries run and which records each caller can reach. An MCP server or other governed read path should query a replica or pre-modeled copy so agents stay off the primary entirely.
Starburst's analysis calls for read-only enforcement, RBAC/ABAC, and audit trails to be in the access layer from the start. The NSA's May 2026 report warns that MCP's rapid proliferation has outpaced development of its security model. The protocol's implementation must enforce authorization while the database routing protects transactional workloads from analytical demand.
How MCP turns a governed Postgres surface into a data layer any agent can reach
An MCP server in front of governed analytical data makes the event store available to MCP-compatible agents without a custom connector for each integration. MCP is an open standard originally created by Anthropic and now governed by the Linux Foundation's Agentic AI Foundation. It defines how agents discover and access external data sources and tools. Authorization still sets what each consumer is allowed to retrieve.
Supabase showed how this works per-app at Select 2026. An MCP server runs as an Edge Function next to the data, users sign in through the existing Auth flow, and each tool call executes as that user. RLS policies decide what the call can reach. This per-app server is distinct from the official Supabase MCP server and uses @supabase/server and the new Supabase Middleware.
Salesforce's Headless 360 platform demonstrates the broader access pattern by exposing CRM data, setup operations, and workflows as MCP tools. The same definitions can serve both the interfaces people use and autonomous agents. A headless MCP setup applies that principle without requiring a dashboard session. A stateless server exposes tools as a background API, while an autonomous client orchestrates the LLM through scripts, webhooks, or cron. Pre-calculated metrics can consequently reach people where they work instead of waiting for someone to open an analytics interface.
What observability and schema governance need to be in place before the first agent query
An events table becomes an operational liability when multiple consumers query it without shared definitions or visibility into query behavior. JSONB allows events to have different shapes, but it does not define what they mean. A data dictionary supplies that missing contract. Each metric needs a single definition agreed across the organization before agents consume it, because an agent cannot be relied on to ask a colleague which version of “active user” applies.
Ambiguity becomes more dangerous when a consumer can act autonomously. Starburst's analysis describes an agent selecting a table and acting without flagging uncertainty about its meaning. A small semantic error can become a confident, incorrect answer. Schema governance is part of the infrastructure that agents run on as well as documentation for people to read. Schema governance aligns how an agent and a dashboard interpret the same records as the same business measure.
Supabase's Supavisor benchmark demonstrated large volumes of simultaneous connections and queries per second, but sub-3ms p95 latency occurred only under lower-load conditions. Capacity and latency are different operating claims. Supavisor belongs in the connection path from the start, with structured logging, p50/p95 latency dashboards, Postgres exporter, and Realtime Prometheus metrics making degradation visible before users report an outage.
Availability strengthens that foundation but does not replace measurement. Multigres, announced at Supabase Select 2026 and built by the team behind Vitess, adds multi-node high availability with built-in connection pooling. It promotes a replica in seconds after a node failure, and committed writes survive. Five or fewer actionable metrics drive decisions for most B2B SaaS teams, avoiding the trap of instrumenting everything without establishing which measures should guide action.
Where Postgres as an event store reaches its limits and what that threshold actually looks like
Postgres is not a columnar engine, and its analytical limits deserve a direct answer. As the events table grows and concurrent analytical consumers multiply, scans and aggregations create increasing query pressure. A read replica isolates that work from production transactions, but it does not change the underlying storage model. A sufficiently demanding workload will need infrastructure beyond the initial Postgres read path.
Sustained event throughput introduces another constraint through write-ahead log, or WAL, backpressure. Using many logical replication slots to serve multiple downstream consumers also adds work to keep the system running, which a dedicated streaming layer handles more cleanly. These are genuine reasons to evolve the architecture. The threshold is a workload condition rather than a universal event-count cutoff, involving sustained ingestion, query pressure, and the number of consumers. The supplied production examples do not establish a numerical limit for that combination.
Most early-stage teams will not approach this point before they have the engineering bandwidth and funding to adapt. Building the eventual streaming architecture at the first event would address a problem they do not yet have. The foundation can remain in place when demand grows. Enabling logical replication exposes Postgres changes to downstream consumers through configuration while preserving application code. The events table is still the write endpoint, and the governed copy is still where agents read the data.
Streamkap's March 2026 agent infrastructure guide describes the larger architecture as source databases, CDC ingestion, stream processing, context stores, and agent interfaces. A Postgres-native event store with MCP provides the source and interface layers from the outset. The middle layers arrive when the workload requires them. This progression preserves the investment in instrumentation and definitions instead of tying the application's event contract to the first analytical engine chosen.
Building the governed event layer: the implementation sequence that keeps agents and humans on the same numbers
Create the minimal events table and add the indexes on event_name, created_at, and user_id before data lands. This makes the initial query path deliberate. Instrument application code and Edge Functions with the fire-and-forget pattern, then verify that analytics writes are not awaited in the user-facing request path. At this stage, the application already produces a common event record without introducing a vendor-controlled silo.
Next, configure Supavisor and route analytical queries to a read replica. This establishes workload separation before more consumers arrive. Define the data dictionary before a second consumer touches the table so everyone agrees on what each metric means. Neither safeguard substitutes for the other, because a fast, isolated query can still return the wrong business answer.
Before agents can make calls, put read-only enforcement, authorization, and audit trails in the governed access path. Expose that path through MCP so compatible agents can discover and query the approved analytical surface. Observability must be active at the same point. Structured logging, Postgres exporter, and p50/p95 latency dashboards make connection pressure and query regression visible as the consumer population grows. Each new layer adds something the system can do while keeping the layer before it in place.
The CEO dashboard, API consumer, and autonomous agent can use different interfaces while drawing ARR, churn, and usage metrics from the same governed definitions. Replicas and downstream processing may change where computation happens as demand increases. They need not change what the business means by a metric or where the underlying events originate.