What Makes an Analytics Backend Truly Headless When Supabase Is Your Data Layer
Headless analytics needs five layers, and semantics is the one that matters most.
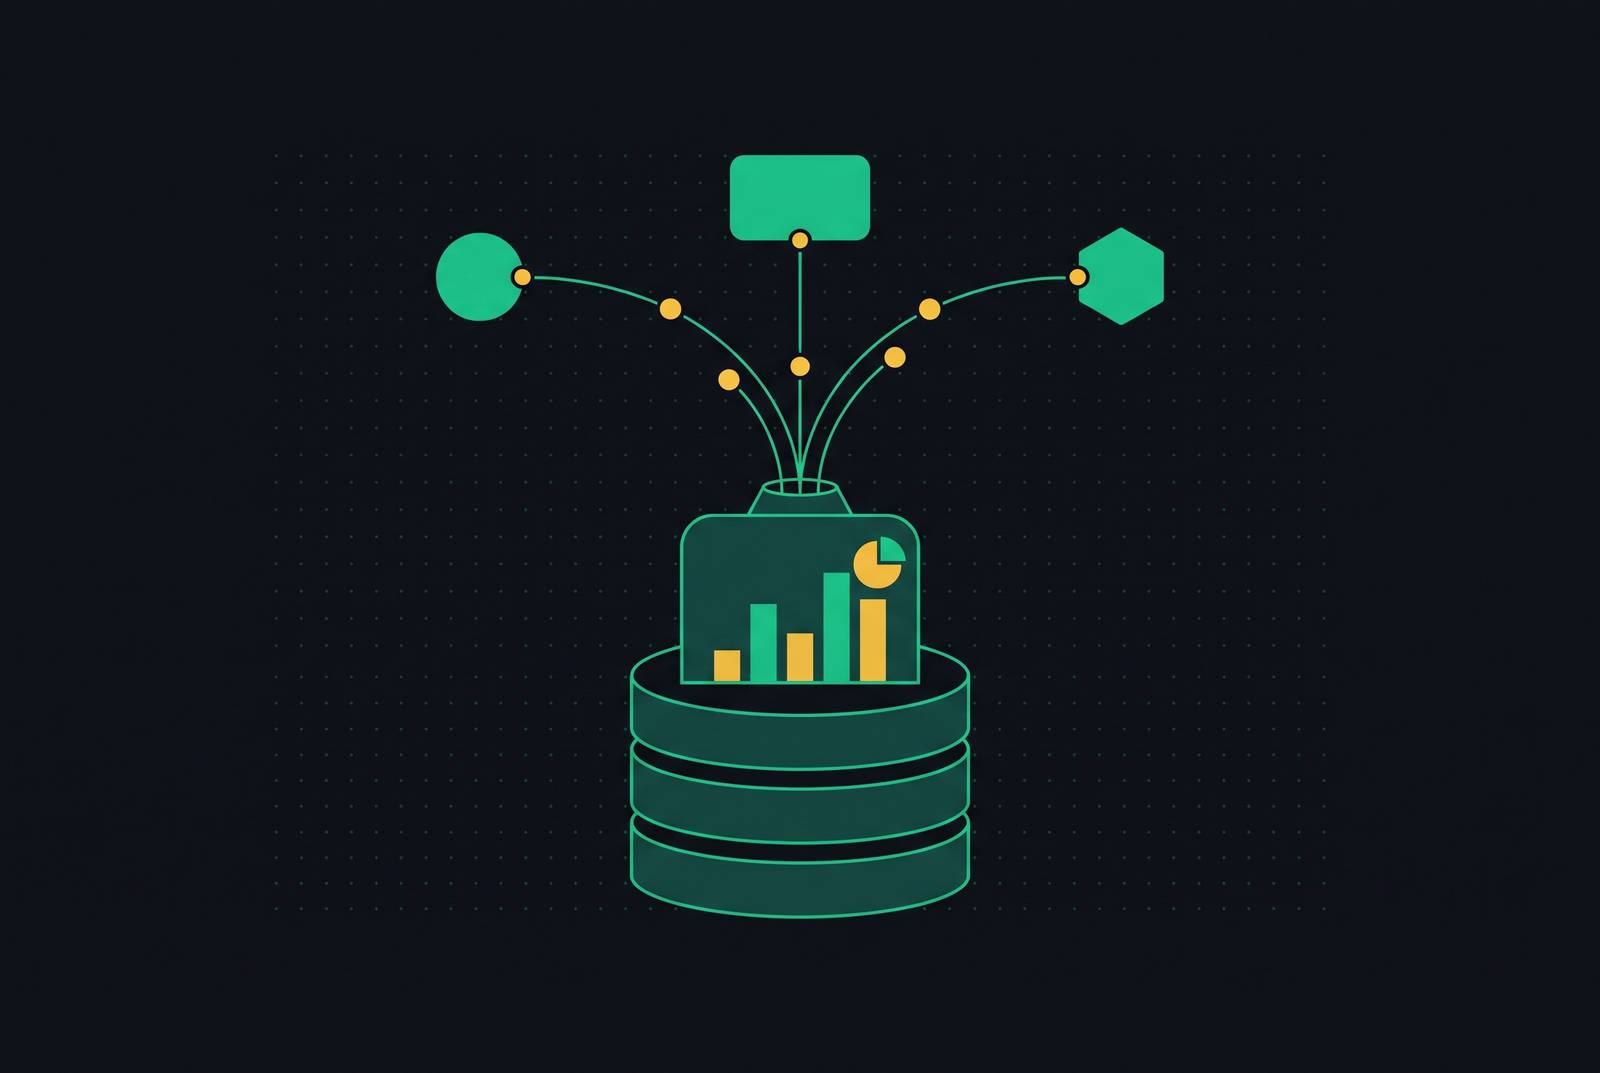
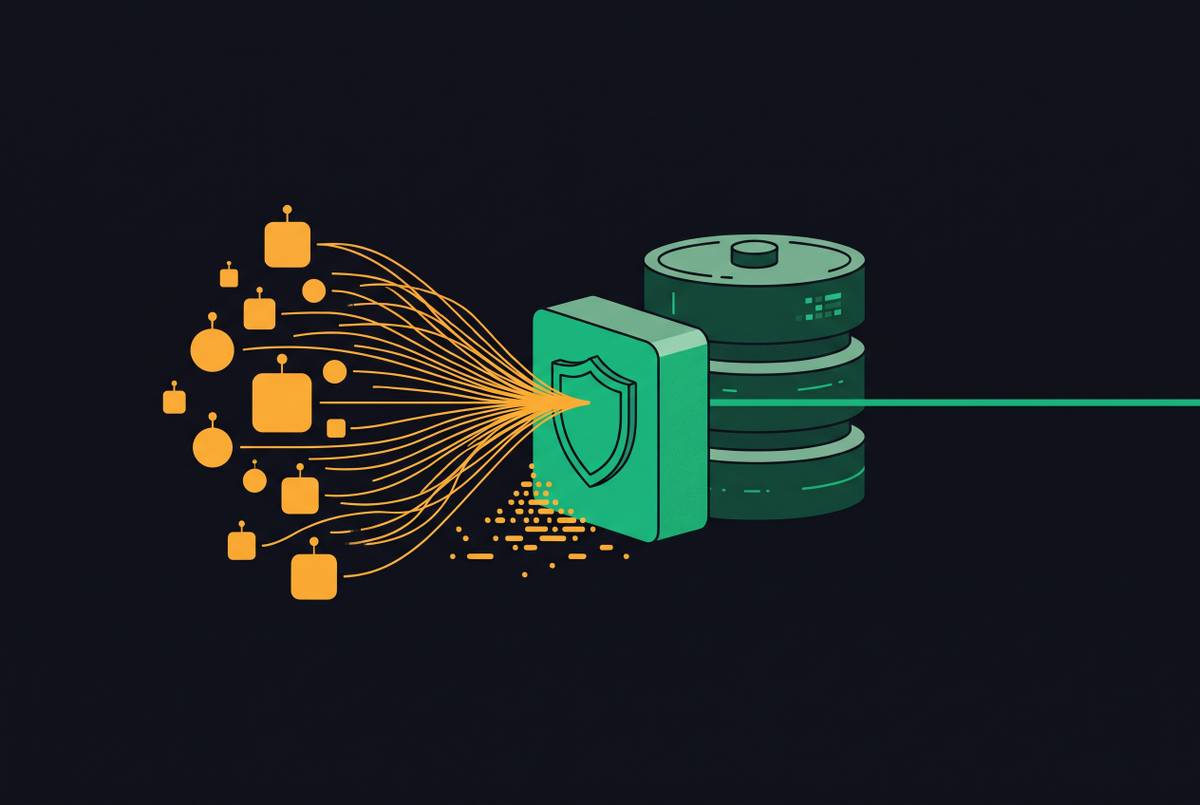
A truly headless analytics backend for Supabase gives dashboards, scripts, and AI agents governed metrics through an API, without tying business logic to a frontend. It requires five layers working together, namely data modeling, semantics, access control, caching and performance, and an API. For API-first and agent-first teams, the decisive distinction is whether consumers retrieve shared business definitions or must reconstruct them from raw Postgres tables.
Why "headless" means something specific in analytics, and what it rules out
“Headless” is already overloaded in the Supabase ecosystem, where it can describe services such as auth and storage. In analytics, its meaning is more exact. Analytics logic must be separate from the presentation that shows its results. A dashboard may consume that logic, but it cannot be the only place where the logic is defined.
A dashboard with an export button exposes results without separating their definitions from the dashboard. A PostgREST endpoint over raw tables exposes data without defining its business meaning. A reporting query wrapped in a function does not, by itself, establish a governed analytics backend either. Each can provide access while leaving downstream consumers responsible for interpreting the data.
That responsibility is what a headless architecture removes from consumers. The backend owns the models, definitions, permissions, and execution path, while each frontend decides how to present the answer. A new interface therefore does not require a new interpretation of the business. When “headless” means only “API-accessible,” teams still rebuild metric logic in every tool, preserving the fragmentation that the architecture is meant to prevent.
The five structural layers a headless analytics backend must have
The first layer is a data modeling layer. Metric definitions, dimension hierarchies, table relationships, and business rules live in code. Without it, every tool or script must reproduce the relationships and calculations it needs.
The semantic layer makes that model usable in business terms. Consumers request defined metrics and dimensions rather than deciphering table names and writing joins. Modeling establishes the underlying structure, while semantics establishes the contract consumers query. That contract separates a request for a business result from the schema used to calculate it.
Access control then governs who can use that contract. It applies permissions to metrics, dimensions, rows, and sensitive columns at the analytics boundary, rather than leaving each tool to interpret database permissions independently. The caching and performance layer lets the backend serve approved requests over and over. Pre-aggregating common queries lets dashboards and agents get results without a full scan of production tables for every request.
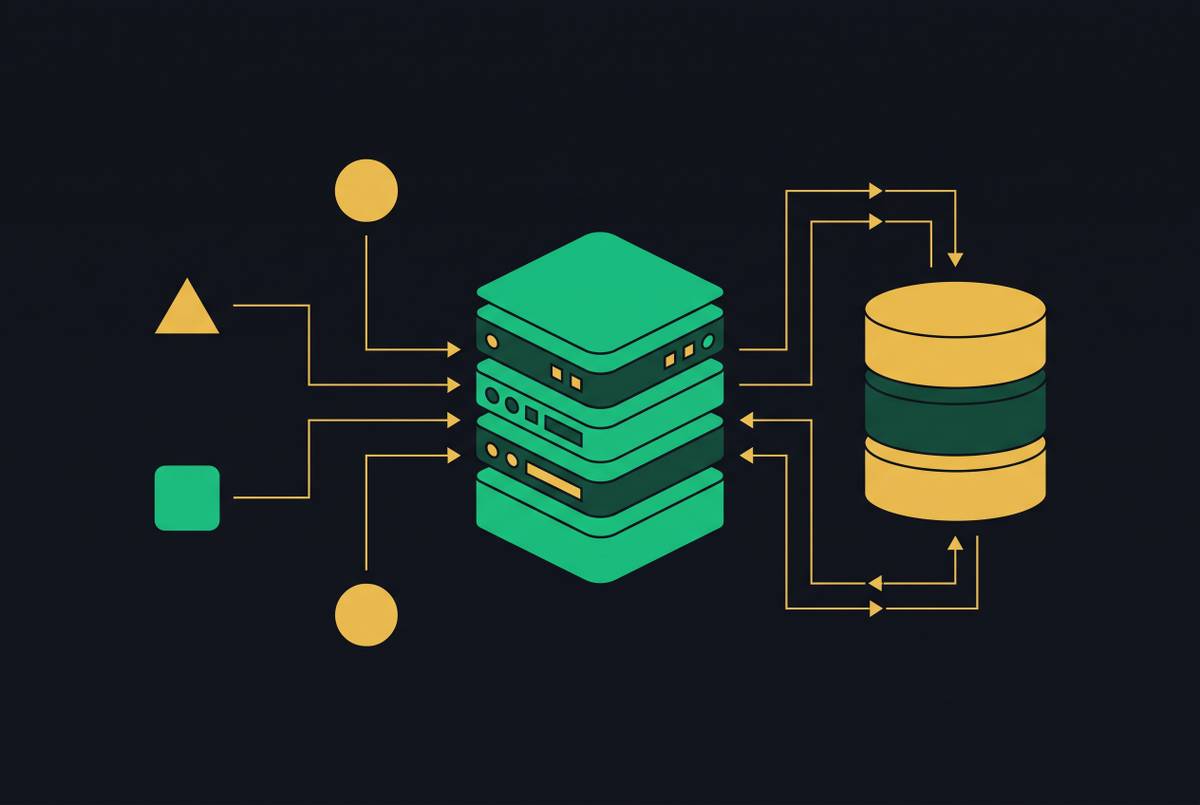
The API layer exposes the governed result to consumers. REST, GraphQL, or SQL interfaces can serve an application, script, Slack bot, or AI agent without giving it direct access to the underlying database. The interface comes last in this logical sequence because it exposes the work of the preceding layers. An endpoint cannot substitute for the definitions, permissions, or execution controls beneath it.
Why Supabase's default architecture satisfies none of these five requirements on its own
Supabase provides a data layer. PostgREST exposes table schemas through REST endpoints. A consumer still needs table names, join logic, and filter conditions to calculate a metric that means something to the business.
Supabase has no native shared analytics modeling layer, so definitions live wherever developers place them, including application code, SQL functions, or dashboard configurations. A second consumer then creates another place where the definition can diverge. Postgres row-level security protects database rows, but on its own it cannot control who can query pre-modeled metrics with given dimensions and aggregation grains. Access to tables also comes without analytical pre-aggregation or a governed metrics API.
The 2026 acquisition of Hydra and the resulting Supabase Warehouse initiative and pg_duckdb integration address the execution side of this problem. The integration embeds a columnar-vectorized analytics engine inside Postgres, accelerating analytical queries without exporting data. That is a meaningful advance for analytics workloads. It does not supply shared semantics, analytics-consumer permissions, or a governed API.
For production deployments, the recommended separation is to run pg_duckdb queries against a read replica to avoid affecting transactional workloads. Supabase can underpin the architecture, but the five analytics responsibilities still need explicit implementation above that foundation.
The semantic layer is the decisive component, and here is what it actually does
“Active customer” looks like a simple business concept until separate consumers have to calculate it. A product dashboard, a growth report, and an agent can each use valid queries but have different rules for who counts. If each consumer owns the definition, careful implementation alone cannot establish one authoritative answer.
A semantic layer centralizes the terms behind that answer. It defines entities such as customers, orders, and sessions, together with metrics such as revenue, churn, and LTV. It also defines dimensions, relationships, calculations, and filters. For “active customer,” the central requirement is that the inclusion rule exists once rather than being inferred independently by each consumer.
This makes semantics a business responsibility. When the growth team adds a dashboard and rewrites “MRR” in its query language, that version can diverge from the product dashboard. The CEO’s weekly number can then disagree with the board deck. With a shared semantic definition, teams no longer have to translate the business rule into every new tool.
A metric such as “Net Revenue Retention” can be examined through its definition, which makes audits and debugging tractable. When the underlying Postgres schema changes, the semantic layer absorbs the change rather than forcing consumers to relearn joins and table names.
How access control at the analytics layer differs from Postgres row-level security
Postgres RLS controls which rows a caller can read. Analytics permissions govern a different unit of access. They determine which pre-modeled metrics a consumer may query, with which dimensions, and at which aggregation grain. Protecting source rows is necessary in many systems, but it does not express the whole analytical policy.
An agency partner illustrates the distinction. The partner may be allowed to see campaign performance aggregated by week, but not raw order data or margin figures. That permission concerns the shape and meaning of the result. It requires the analytics layer to distinguish an approved aggregate from access to its source records.
The same boundary includes column-level masking, metric-level permissions, and dimension-level scoping. A consumer might be allowed to query “sessions by channel” but not “revenue by customer.” A UK team might be restricted to UK data regardless of the metric requested. These rules need a shared understanding of metrics and dimensions to remain consistent across interfaces.
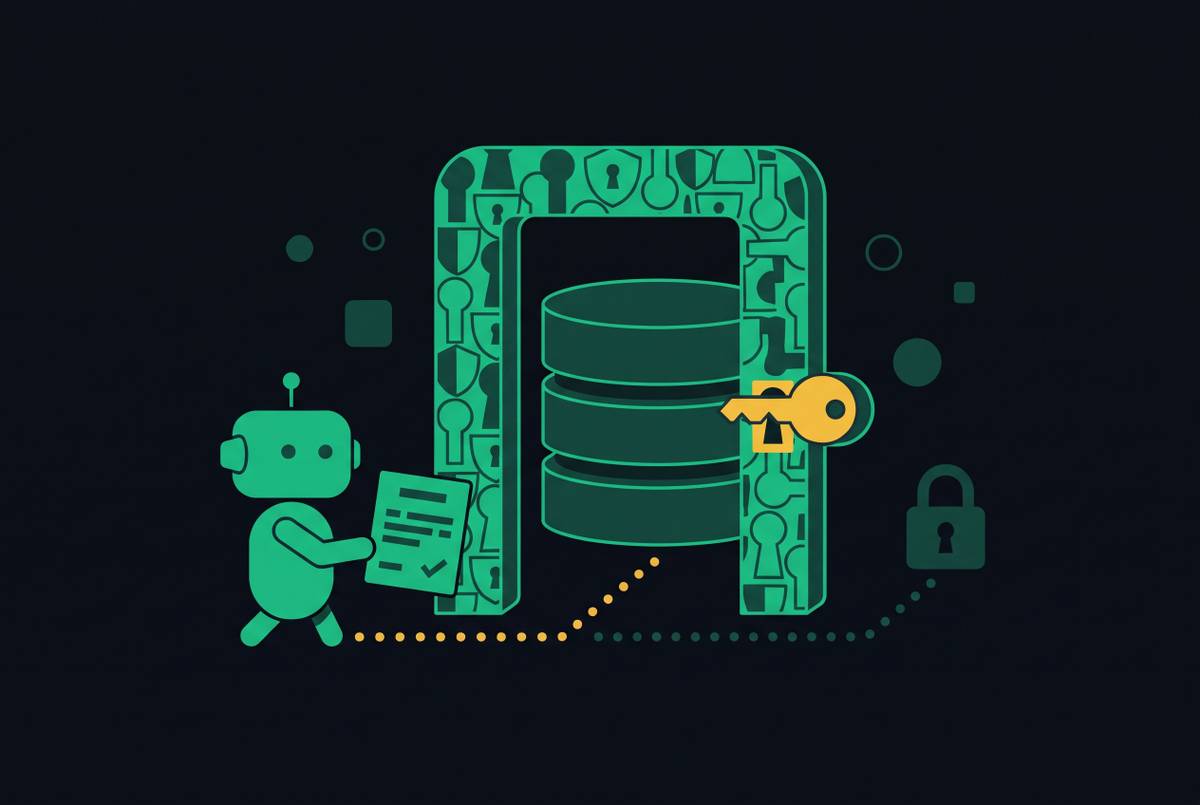
When consumers connect directly to production, access decisions instead become entangled with database policies and schema knowledge. For each new access path, someone has to turn what the business wants to allow into database rules. A headless backend provides a single analytical checkpoint. Permissions are defined in business terms and enforced regardless of whether a dashboard, script, or agent initiates the request.
Why AI agents make a governed analytics layer urgent rather than optional
Agents extend analytical errors beyond a misleading display. They can act on external systems, execute multi-step plans, and maintain persistent state, so an incorrect interpretation can cascade into later actions. A human reviewing the output may not recognize the original mistake. Correct SQL can still use the wrong business logic.
Semantic bypass is the central risk. An agent may call a direct SQL executor instead of approved semantic resources and return a result that looks right but uses the wrong definition. The agent retrieves a metric definition, confirms the allowed dimensions and filters, submits a governed query, and receives a response with provenance.
Identity must be explicit within that pattern. A support agent and a financial reporting agent should have separate identities, credentials, and database access. Each needs an allow-list of metrics and dimensions. For usage analytics without a prebuilt dashboard, that governed interface supplies the necessary access without making a visual frontend part of the dependency.
Anthropic developed MCP, or Model Context Protocol, as an open standard for AI systems to communicate with external tools and data repositories. A safe architecture exposes semantic resources and governed query tools through the MCP server, with validation before execution. Identity, performance, lineage, and auditability still belong underneath it.
Agents should not query the production transactional database for analytics. Unbounded analytical queries put pressure on connections, cause lock contention, and let slow queries pile up, while agents can send many requests at once or on a schedule. Pre-calculated, pre-modeled datasets served by a fast analytical engine such as DuckDB are safer for consumers to query. They are cheap to query, fast to return, and read-only by design.
What observability of the analytics layer requires, distinct from database observability
Postgres observability covers query latency, connection counts, cache hit ratios, and slow query logs. The pg_stat_statements tool records mean and total execution time and call count for each query. Those measurements cannot establish whether “Monthly Active Users” was calculated consistently across consumers.
Metric-level query logs identify the requested metric, consumer, parameters, and aggregation grain. Definition drift detection shows what changed in a metric and which consumers the change affects. Agent activity auditing connects the queries an agent initiated with the results it received and the actions it took next. Together, these records make it possible to examine whether access followed the governed definition.
At lower traffic levels, slow analytical queries may be tolerable, but accumulated requests can consume connections needed by transactional work. When active connections near max_connections, a cache hit ratio falls below its target, or replication lag grows, these are signs that workloads are competing for resources. Separating analytical and transactional query paths addresses the structural problem, while monitoring shows whether that separation is working.
Observability belongs in the architecture from the start. Installing it only after a production incident leaves the team reconstructing a problem it could have detected earlier. The same principle applies to semantic correctness. A backend cannot establish trust merely by returning answers quickly if it cannot show which governed definitions and permissions produced them.
The test for whether an analytics backend built on Supabase is truly headless
Are metrics written once, in a shared form that every consumer can use without rewriting them? Definitions confined to application code or a dashboard configuration fail the modeling test. The semantic test asks a different question. Can a new tool or agent request those metrics without learning the Postgres schema, table names, or join logic?
Can an external agency or agent receive permission for specific metrics at a specified aggregation level without a production database credential or a new production RLS policy? If not, the analytical checkpoint is missing. The performance test then examines where requests execute. When analytical requests appear in production slow query logs, the intended caching and workload separation are failing to protect transactional work.
The final test concerns consistency through the API. Can an AI agent, a Slack bot, and a custom internal dashboard retrieve the same “Weekly Active Users” figure without implementing SQL independently? Separate implementations expose a gap even when every consumer has an endpoint. Four tools with four definitions can produce four numbers for the same concept, and adding agents compounds that divergence.
For teams with these gaps, the direction is a single governed layer between Supabase and every consumer. It combines pre-modeled datasets, shared semantics, scoped identities, and a fast query interface. DuckDB on pre-calculated Parquet is one proven pattern, with an API or MCP server exposing governed resources, which is the approach Dreambase, an AI-native analytics layer for Supabase teams, takes by letting agents query governed metrics through MCP without ever touching the production database. Building that boundary before consumers multiply avoids later consolidation work.