Postgres as an Analytical Substrate for Supabase Projects
Use Postgres materialized views and DuckDB to run analytics without straining transactions.

Analytics for Supabase teams can start with Postgres. Materialized views, shared metric definitions, and governed datasets queried through DuckDB can support dashboards, reports, and AI agents while keeping Postgres as the transactional source of truth. The right architecture depends on workload boundaries, especially analytical concurrency, latency requirements, and the effect of reads on application writes.
Why Postgres is already your Supabase project's analytical starting point
Supabase places Postgres at the center of the application’s data model. Transactions, user events, and business facts already live there, so analytical work begins with an existing source of truth. Teams must assess how much analytical work the database can absorb, what extensions that work requires, and when a separate execution engine becomes justified.
Keeping analytics close to transactional data also preserves operational simplicity. One database gives a team one system to run before it adds other systems. That simplicity has a condition, however. Analytical reads must leave the database able to do its main job of serving application transactions.
What Postgres's row-oriented storage actually means for analytical queries
Postgres’s heap storage keeps all columns of a row together on disk. An aggregation that scans one column across millions of rows thus has a different read cost from a columnar engine, which can read just the column it needs. ClickHouse’s documentation places vanilla Postgres OLAP latency at roughly 10–100× that of a columnar engine on the same hardware. The constraint begins with the storage layout. Broad aggregation scans require work that a selective transactional lookup does not.
Indexes can defer that constraint, but they do not remove it. Tuning can address missing indexes, autovacuum lag, and lock contention, while the row-store scan pattern comes from how the database is built. This difference matters to how the database runs when analytical reads share an instance with application writes. The cost extends beyond a slow dashboard. Analytical work can degrade OLTP tail latency and, at sufficient scale, bring reads and writes into contention, so credible extensions must work within that constraint.
The viable envelope: where Postgres handles analytics without a separate system
Postgres is a capable analytical substrate at roughly hundreds of gigabytes, with latency tolerance in seconds and query rates typical of internal reporting. Volume alone does not settle the decision. A handful of analytical queries per day presents a different workload from frequent, high-concurrency requests feeding user-facing dashboards. Internal consumers who can wait seconds are a better fit for this envelope than end users who need a sub-second SLA.
The choice is strongest when organizational simplicity is worth more than the additional performance of a second system. It also depends on analytical aggregations having no measurable effect on OLTP tail latency or transaction throughput. Both conditions need to hold in practice. A manageable dataset does not justify keeping analytics on production Postgres if the application is already paying for those reads.
Postgres is reaching its limit when dashboard latency keeps rising despite work on indexes and vacuum. Autovacuum pressure from large append-mostly event, log, or telemetry tables is another warning when it degrades writes. Analyst queries blocking application writes through locks, or disrupting them through shared-buffer eviction, provide a further signal. These symptoms warrant an architectural assessment. Before they appear, however, several in-database techniques can extend the useful range of the existing system.
Native Postgres patterns that extend the analytical envelope without new infrastructure
Materialized views store pre-computed query results as tables. Repeated requests read the stored result instead of recomputing a complex aggregation or join across raw rows. An MRR materialized view over a subscriptions table is a concrete example, with subsequent dashboard queries reading the prepared metric. Its value depends on the refresh cadence. Hourly or daily dashboards are a strong fit when source data changes slowly relative to that cadence.
Indexing cuts down the number of rows a query must read. Partial indexes work especially well when analytical requests keep filtering on the same predicate, such as active users or non-cancelled orders. Their scope is narrower than a general scan remedy. EXPLAIN ANALYZE exposes sequential scans, high-cost hash aggregates, and missing index opportunities so that index work follows the actual execution plan.
Connection pooling eases the pressure from consumers. Each Postgres connection consumes meaningful memory, and unmanaged connections from dashboards, BI tools, and agents can exhaust the connection limit. PgBouncer shares a small number of database connections across many clients. Row-level security policy authoring deserves equal attention for multi-tenant analytics. Supabase’s benchmarks show roughly 20× gains from wrapping a bare auth.uid() call in a subquery so it evaluates once rather than per row, with gains exceeding 100× when combined with a proper index on the policy column.
Extensions offer another, workload-specific route to analytical execution. pg_duckdb embeds DuckDB inside Postgres for in-process columnar queries and ad-hoc aggregations on a single node. TimescaleDB’s Hypercore provides hybrid row-and-column storage for time-series-shaped workloads, particularly time-bucketed analysis of append-only events or telemetry. Both run inside the same Postgres process on the same hardware as OLTP, leaving limits beyond their workload niches. The next extension is therefore architectural, changing how metrics are defined and consumed.
Why pre-modeled datasets matter more than fast queries
If one engineer calculates revenue with SUM(revenue) and another uses SUM(amount_captured), Q2 revenue can diverge until an investor asks for audited figures. The database may execute both queries correctly. The failure lies in the absence of a canonical definition.
A shared database is not a shared data dictionary. MRR, CAC, LTV, churn rate, and cash runway each depend on decisions about what the metric includes. Without those definitions, each query has its own take on what the metric means. Pre-modeled, governed datasets establish the calculation in one place, giving dashboards, reports, and agents the same result. Pre-calculation then provides both reusable computation and a controlled definition, rather than merely making an arbitrary aggregation faster.
Before product-market fit, the discipline is to choose five or fewer KPIs that drive decisions and define them precisely. For most B2B SaaS teams, those are CAC, LTV, monthly churn, ARR, and gross margin. The selection constrains the modeling work that follows. It directs attention toward a small set of decision-bearing datasets rather than an expanding collection of loosely defined dashboard queries.
How to get analytics and dashboards through a governed layer over Postgres
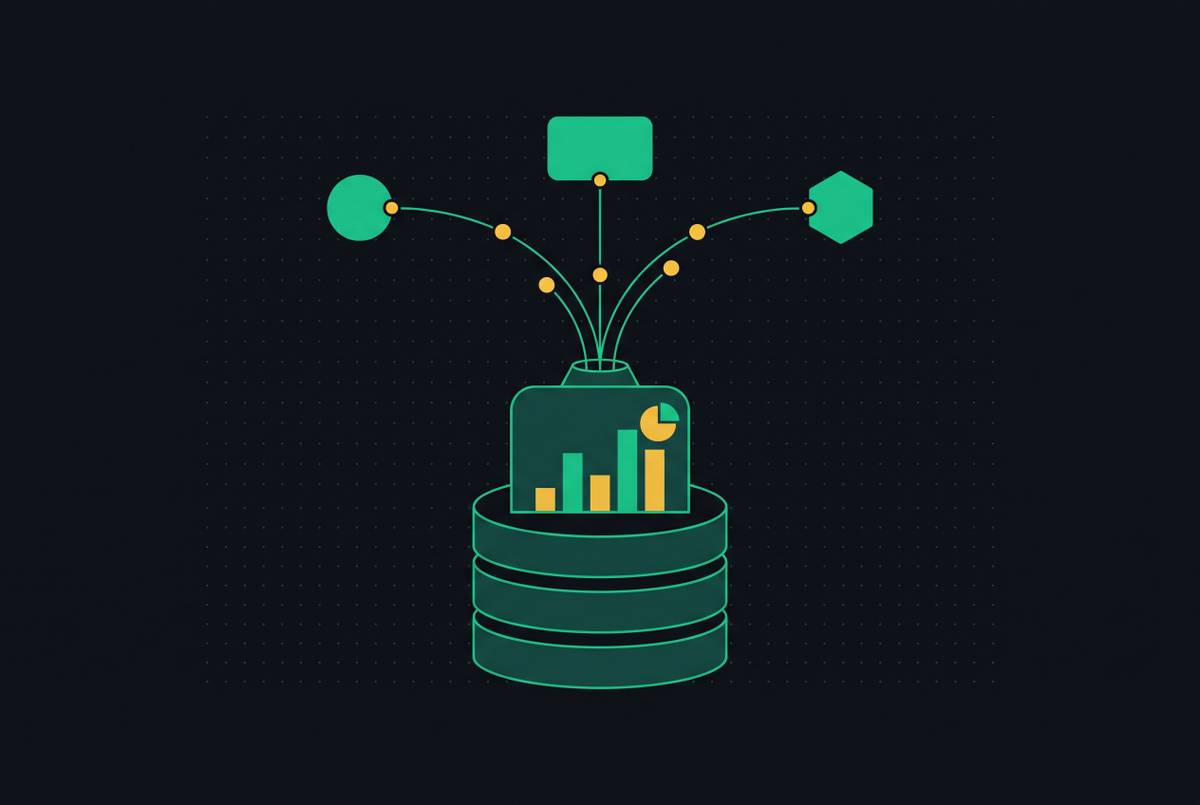
A governed data layer turns raw Postgres tables into defined metric datasets, exposes a queryable interface, and enforces access controls. The pattern does not require a separate warehouse, changes to the transactional schema, or an ETL pipeline to maintain. Postgres remains the transactional source of truth. The analytical layer supplies reusable definitions and an access boundary above it.
In this pattern, pre-calculated metrics are materialized as governed Parquet datasets and queried through DuckDB. DuckDB executes analytical reads against those datasets outside Postgres, separately from OLTP queries on the production database. The semantic layer centrally defines complex calculations such as MRR, LTV, and churn, while the query engine serves the prepared data.
That separation also changes how dashboards fit into the architecture. Under the headless analytics pattern, the presentation interface is decoupled from the definitions underneath, much as a headless CMS separates content from presentation. A dashboard is one consumer of business logic. The same metrics can feed a Slack report, an inbox, a phone notification, or an agent call, so access does not depend on someone remembering to open a dashboard.
Why AI agents change the data access architecture, not just the interface
An agent given raw production tables gets the data but may lack the business meaning behind it. It may calculate SUM(revenue) when the intended definition is SUM(amount_captured) WHERE status = 'paid', then propagate the error through its output. The resulting answer can look entirely plausible. Direct production access adds another risk because agent queries can trigger full table scans, exhaust connections, or read unauthorized data when access controls are misconfigured.
The Model Context Protocol, originally developed by Anthropic and now governed by the Agentic AI Foundation under the Linux Foundation, standardizes communication between AI systems and external tools or repositories. MCP separates the AI client, the server containing connector logic, and the resource being accessed. It is an interface. Identity, governance, semantic grounding, query performance, lineage, cost controls, and auditability still require support underneath that interface.
The safe pattern is a read-only resource server exposing governed, pre-modeled datasets. A strong analytics MCP server offers semantic resources along with query tools so an agent can use defined metrics. DuckDB can query the governed Parquet datasets without giving agents direct production access. Humans and agents then share the same definitions. The architectural change is not merely a conversational dashboard, but a controlled unit of data consumption that includes both the result and its intended meaning.
Observability as the mechanism that tells you when the architecture needs to change
Query-level visibility makes the workload boundary observable before it becomes a production incident. Rising latency, autovacuum pressure, and connection exhaustion otherwise remain poorly understood until application performance suffers. Supabase projects need this visibility from day one. It provides the basis for deciding whether Postgres still fits the analytical workload.
The minimum practical stack combines pg_stat_statements with auto_explain and regular review of the provider dashboard. pg_stat_statements records mean and total execution time and call counts, exposing which queries consume the most resources. It is preloaded on most managed Postgres services but typically requires CREATE EXTENSION to activate. auto_explain supplies the corresponding execution-plan details for slow queries automatically.
The setup should have one alert for each critical metric. Average query time above 500ms is the explicit latency threshold, while CPU alerts should detect sustained high utilization over several minutes. Connection alerts should fire above a high fraction of the connection limit, and error-rate alerts above a low threshold of total requests. A quarterly review of the top queries by total execution time captures much of the value at almost no infrastructure cost. These measurements answer when the architecture needs to change, leaving the choice of destination as the next decision.
When Postgres as analytical substrate reaches its limit and what comes next
The strongest objection to starting with Postgres is that simplicity can defer architectural pain. By the time analytical reads contend with application writes on the database, product and partner contracts may already assume the database can handle every workload. Migration can then become more expensive than anticipated. Accepting the boundary from the start means placing metric definitions, governance rules, and access patterns in a layer that can outlast the execution engine.
The Unified Data Stack pattern pairs a dedicated transactional Postgres instance with a separate columnar analytical engine. Real-time Change Data Capture connects them with replication latency measured in seconds. ClickHouse’s 2026 managed Postgres comparison identifies this architecture for teams that need Postgres as the OLTP system of record and dedicated columnar execution for high-concurrency analytics. The source of truth does not change. Analytical compute moves while the governed definitions and access rules stay the same.
Inside the viable envelope, moderate data volumes, infrequent analytical requests, and no measurable OLTP contention favor the simpler governed-layer-over-Postgres architecture. At the boundary, persistent dashboard latency, autovacuum pressure, and connection contention signal that analytical compute should move off Postgres. Beyond it, terabyte-scale data, high-concurrency user-facing dashboards, and multi-team analytical consumption favor the separate-engine pattern. The durable investment is the data contract.