Metric Endpoints as Postgres-Native Infrastructure Primitives for Teams That Ship AI Products
Metric endpoints let AI agents query analytics without taxing production Postgres.

For teams shipping AI products on Postgres, a headless analytics backend should expose versioned, governed metric endpoints. This gives teams API control without an opinionated frontend and keeps agent reads off production. Metric endpoints deserve the same standing as API routes and schema migrations because they make business definitions durable, shared infrastructure.
Why agents querying production Postgres is an infrastructure problem, not just a security concern
Pointing an agent at the database that powers the application puts analytical requests on the same connection pool as live OLTP traffic. Repeated analytical queries can exhaust connections that the application also needs, making direct access a structural design failure as well as a permission problem. A read-only credential does not separate those workloads.
The credential also gives tool calls the authority of an authenticated user, potentially including permission to write or delete. Uchi Uchibeke’s March 2026 paper, Before the Tool Call: Deterministic Pre-Action Authorization for Autonomous AI Agents, documents social engineering succeeding against model-only controls in 74.6% of attempts in a live adversarial testbed, dropping to zero under a restrictive policy layer. Alignment works on probabilities, while a policy layer can block an action before it runs.
Accuracy is exposed to the same coupling. Row-level security policies that re-evaluate auth.uid() for every row can turn millisecond queries into timeouts, leaving agents with stale or partial results and no signal of the underlying problem.
What breaks specifically on Supabase when analytical load lands on the production instance
Supabase’s pooler can become the first bottleneck before compute capacity does. An agent that runs analytical queries over and over takes up slots that application requests also need. RLS friction compounds that pressure because policies designed for per-user row filtering are not designed for service-account queries across a full table. Query shape becomes consequential at this boundary. Postgres can re-evaluate auth.uid() per row when it treats the function as volatile and the call is outside a scalar subquery.
Application schemas introduce another source of uncertainty. JSONB columns, common in Supabase applications, need explicit casting for predictable charting and aggregation. An agent that constructs SQL without understanding those types can produce unpredictable results even when access is authorized. Analytical work is arriving through an interface designed around application data and application access patterns.
Supabase’s documentation addresses these tradeoffs through read replicas, performance advisors, Index Advisor, and log drains for alerting. A replica offloads analytical queries, but it runs at the primary’s compute size and bills separately. Paying the same compute charge again, plus the extra disk cost, can bring database spend to roughly twice what it was or slightly more. Diagnosis also requires visibility into query behavior. Supabase includes pg_stat_statements by default in every project and has docs on slow query logging, connection and pool metrics, and how to track table and index size.
Supabase also acquired Hydra, a co-developer of pg_duckdb, to build Supabase Warehouse. The extension embeds DuckDB’s columnar-vectorized engine inside Postgres, allowing analytical acceleration without exporting data or managing a separate system. That addresses where analytical work can run efficiently. It does not, by itself, establish a shared business definition for every consumer.
Why pre-calculated metric endpoints fix the root cause rather than the symptom
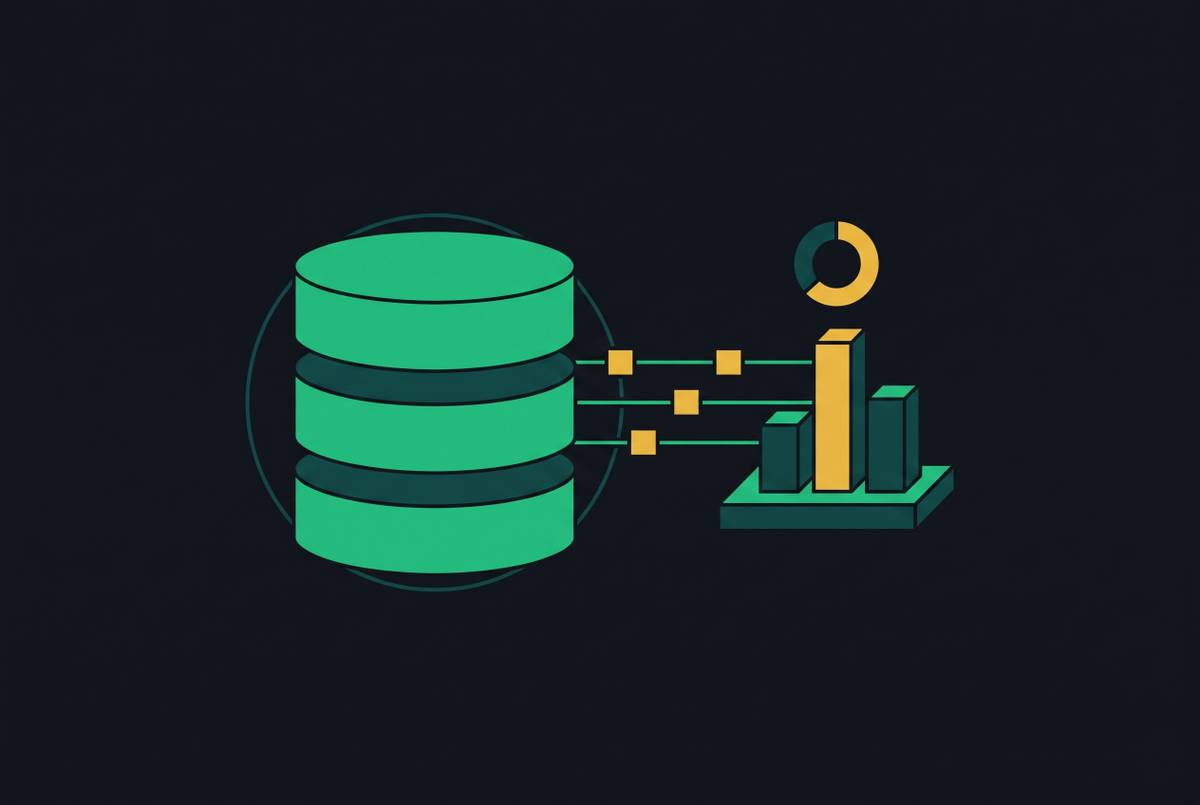
The common root cause is that consumers reconstruct metrics against live production data. A dashboard and an agent can each issue different SQL for what appears to be the same business question. Pre-calculation moves that definition into a governed layer, calculates it on a schedule, and stores the result behind a stable interface.
This is different from adding a cache. Caching is a performance decision about reusing a result, while pre-calculation is a governance decision about which calculation becomes authoritative. When the result is served separately from production, agent reads no longer consume production pooler slots. Access checks apply to governed metric output, and the agent receives a bounded value.
Postgres materialized views provide a native starting point because they compute and store query results. They can refresh on demand or on a schedule through tools such as pg_cron. However, they remain inside the production database and share its constraints. Exporting their results to a governed, separately queryable surface establishes the endpoint boundary. The scheduled calculation still reads source data, but each downstream request no longer runs analysis on production.
What promotes a metric endpoint to an infrastructure primitive
A metric endpoint becomes an infrastructure primitive when it is versioned, governed, durable, and shared. These properties give it standing independent of the tool that first needed it. A calculation stored inside a dashboard belongs to that dashboard’s workflow. An endpoint instead belongs to the analytical layer, with a contract that every dashboard, agent, and report can use.
Versioning makes changes to that contract explicit. The calculation lives under version control, and a breaking change requires an explicit new version. Consumers pin to that version as they would pin to an API version. A change to the meaning of ARR therefore becomes a deliberate interface change. The definition has a lifecycle beyond its first query.
Governance enforces who may read the endpoint and what output they may see at the endpoint itself. Durability then separates the metric’s lifespan from any downstream tool, so replacing a dashboard does not destroy its business definitions. Shared access completes the contract. A human analyst and an AI agent get answers to the same question through the same endpoint, without keeping separate calculations.
The analogy to a schema migration is precise. A migration makes a versioned, durable change to the data layer that all consumers must respect. A metric endpoint gives a business definition the same standing in the analytical layer, so someone writing a downstream query cannot override it by mistake. The API-route analogy adds a concrete access contract. Consumers request a defined result from a stable surface rather than gaining discretion over its implementation.
This discipline does not require a large metric catalog. For an early-stage B2B SaaS team, the proposed set is activation rate, churn, ARR, CAC, and gross margin. Each has one definition, one calculation, and one place from which it is read. Without those properties, a saved query can be silently forked by anyone who disagrees with its number. Infrastructure makes that disagreement visible as a change to a shared contract.
How MCP turns metric endpoints into agent-consumable infrastructure
MCP gives agents a common interface to the governed layer without a custom integration for each agent or model provider. Its primitives map directly onto the endpoint architecture. Resources stand for governed, pre-calculated datasets, and Tools let agents read from them through read-only retrieval. Prompts encode repeatable analytical workflows, allowing a request such as “weekly churn” to resolve against the same definition each time.
The July 2026 MCP protocol revision removed an operational barrier to serving this interface. The core moved to a stateless request/response model, replacing the need for sticky sessions and a shared session store. Requests can go to any instance behind a plain round-robin load balancer. Tool-list responses are cacheable for as long as the server’s ttlMs permits. Small teams thus have less session infrastructure to look after when self-hosting.
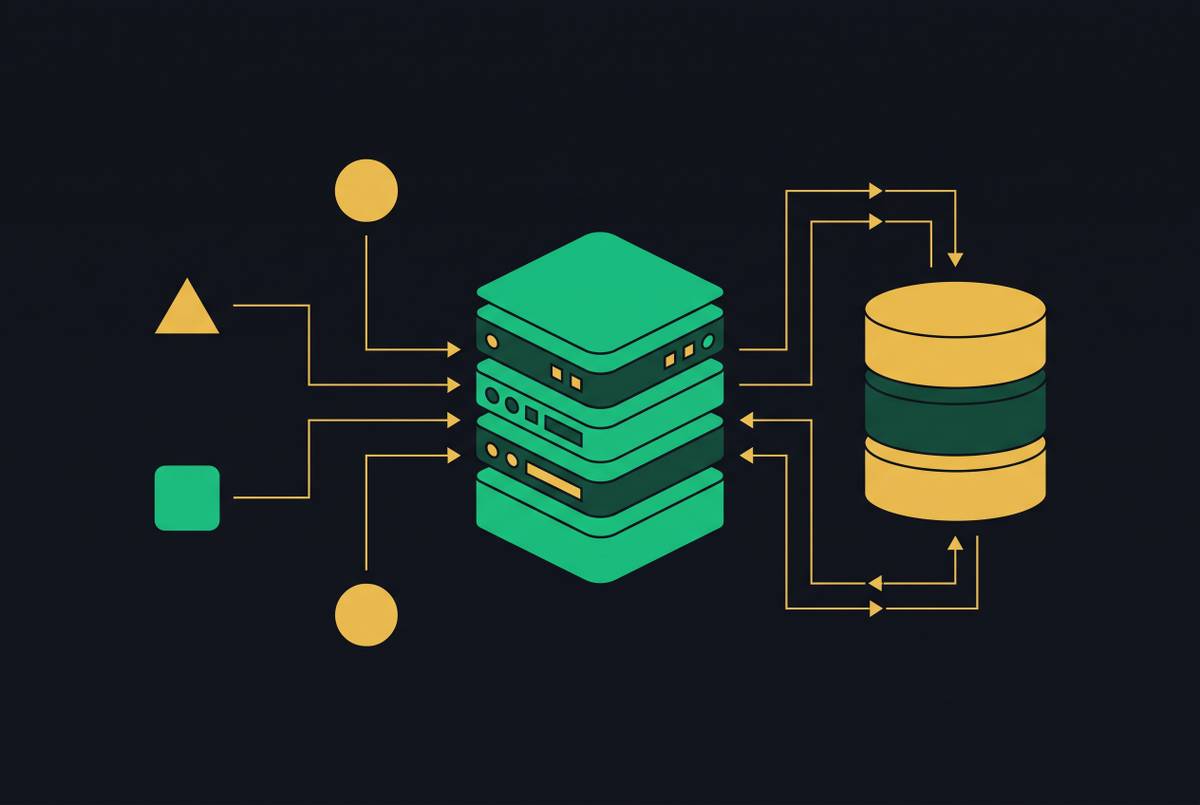
In this architecture, the MCP server stands between the agent and governed Parquet datasets queryable through DuckDB. Production credentials remain outside the agent’s reach. The agent sees a tool that returns a governed metric value, with the production connection string, schema, and pooler kept out of view. This makes MCP the delivery protocol for the primitive.
What safe agent-to-metric access requires at the architecture level
Protocol access alone does not make an agent safe. The governed layer must give agents no way to write to or delete from production, whatever prompt leads to a tool call. Read enforcement is therefore a property of the available interface. A successful prompt injection cannot invoke a production write operation that the tool does not provide.
Authorization must also follow the requester’s identity. An agent acting for a sales rep must not gain access to finance data merely because the agent can call a shared server. Role-based access belongs at the tool level, before the metric is returned. The shared interface checks permissions in one place instead of leaving each agent connection to work them out on its own.
Every read also needs a deterministic audit trail recording identity, timestamp, and the specific endpoint version queried. Uchibeke’s Open Agent Passport formalizes pre-action enforcement with a cryptographically signed audit record. Five Eyes guidance calls for cryptographic signing and audit logging controls. An ordinary access log alone is not that signed record. The architecture must distinguish observable activity from cryptographically recorded authorization if it is to provide both.
Pre-calculation further limits the scope of an injected instruction. The agent’s tool returns a value instead of letting it run any SQL it chooses against production. Its remaining exposure is bounded by the governed surface and the requester’s permissions. That boundary is narrower than relying on the model to choose a safe query against production.
How metric endpoints support a single source of truth across both humans and agents
Human metric disagreements and unreliable agent answers share a definitional problem. Without a strict data dictionary, teams can give different numbers for how the same business is doing. Discussion then shifts from decisions to disputes about calculations. A versioned endpoint makes the dictionary executable. A different definition of ARR requires a visible, reviewable version.
For Supabase-native teams, production Postgres remains the raw source for activation rate, usage frequency, and retention. The architecture separates that source from the governed definition and from its consumers, whether they are dashboards, agents, or Slack reports. Pre-calculated metrics can be pushed to inboxes, Slack, and scheduled reports, while agents retrieve them programmatically on a schedule.
A seed-stage founding team can keep this layer narrow. The five endpoints for activation rate, churn, ARR, CAC, and gross margin form the proposed minimum viable metric infrastructure, readable by both human interfaces and agents. No particular frontend owns their meaning. This is headless analytics, a governed backend decoupled from its consumers. Just as a headless CMS separates content from its renderer, headless analytics separates business metrics from the dashboard or agent that presents them.
How does a Postgres-native team implement this with raw API access and no prebuilt dashboard?
The team can start without a dedicated data engineer, a separate data warehouse, or a schema migration. Before pre-calculating metrics, the team should establish production observability through pg_stat_statements, slow query logging, and visible connection pool metrics. These reveal which queries consume time and when agent traffic creates pressure. Without those checks, the team cannot tell which calculations need pre-calculation or how much pressure production is under.
The first implementation step is to name the five core metrics and agree on each exact calculation with stakeholders. That written agreement is the data dictionary before it becomes infrastructure. Next, the team should materialize each calculation into a governed Parquet dataset queryable through DuckDB. Serving reads from those datasets keeps downstream analytical requests off production and makes results inexpensive to serve at high concurrency. The scheduled calculation becomes distinct from the consumer’s request.
The calculation should then be treated as code under version control, with new versions for breaking changes and pinned versions for consumers. A single MCP server can expose the datasets as Resources and read-only metric retrieval as Tools. Tool-level RBAC and an audit log govern access. Agents connect to that surface instead of production, and human interfaces can use the same metric layer without a prebuilt dashboard.
Finally, delivery should be scheduled to Slack, email, or a dashboard at a cadence the team actually monitors. Agents can follow that cadence programmatically. The implementation sequence moves from an agreed definition to a separately served result, then to a versioned and controlled interface. The frontend remains replaceable because the business definition no longer lives inside it.